Missouri students experience the school to prison pipeline on a daily basis. Students of color and students with disabilities are punished more frequently and more severely than their peers. The ACLU of Missouri is determined to disrupt the school to prison pipeline which results in disproportionate discipline and over entanglement with law enforcement. Join the fight, learn what's happening in Missouri schools below.

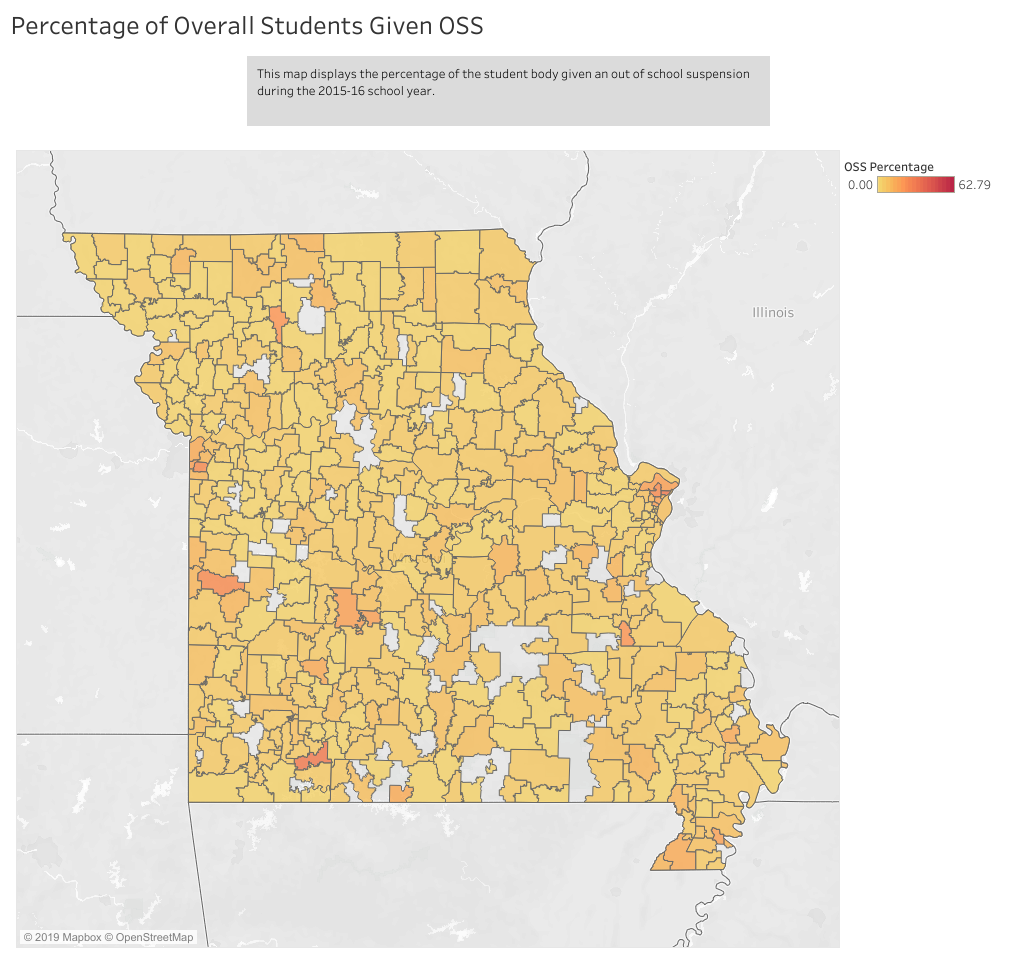
Percentage of Overall Students Given Out of School Suspension - Map 1: This map displays the percentage of the student body given an out of school suspension during the 2015-16 school year. 

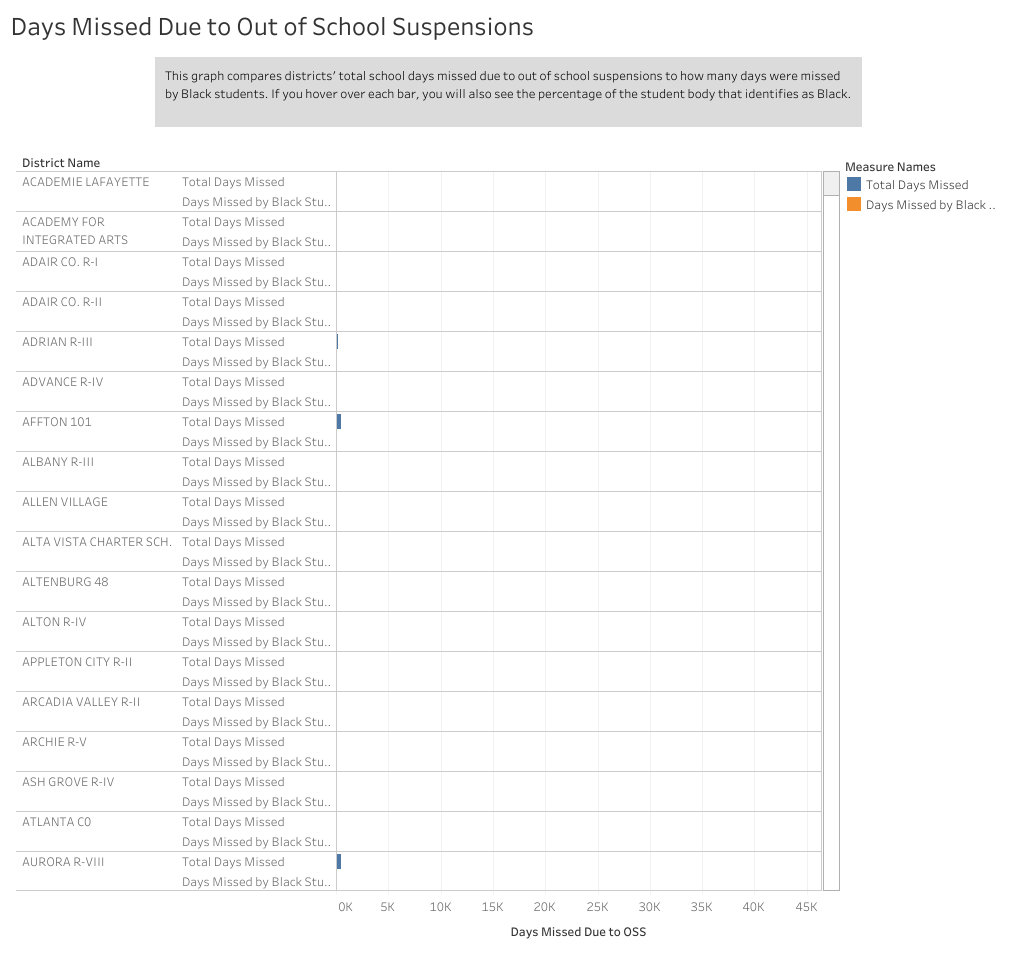
Days Missed Due to Out of School Suspensions - Graph/Map 2: This graph compares districts' total school days missed due to out of school suspensions to how many days were missed by Black students. If you hover over each bar, you will also see the percentage of the student body that identifies as Black.

Relative Risk of Suspension for Students with Disabilities - Map 3: This map depicts the relative risk ratio of suspension at the district level. Relative risk ratios are a measurement that compares the rate at which one student subgroup receives a disciplinary action to the rate of another subgroup. In this case, the number would be interpreted as follows: In (District Name), IDEA students were XX times more likely to receive an out of school suspensions than their Non-IDEA peers. If you hover the clicker over any district, you will see the relative risk ratio, as well as the percentage of the student body identified as IDEA in each district.
 

Relative Risk of Suspension by District - Map 4: This map depicts the relative risk ratio of suspension at the district level. Relative risk ratios are a measurement that compares the rate at which one student subgroup receives a disciplinary action to the rate of another subgroup. In this case, the number would be interpreted as follows: In (District Name), Black students were XX times more likely to receive an out of school suspensions than their White peers. If you hover the clicker over any district, you will see the relative risk ratio, as well as the percentage of the student body identifying as black in each district.